
Hormuz and the Handover Myth: Why Supply Shocks Don't Fund Clean Energy, They Fund Oil Majors
The Iran war has delivered the worst oil crisis in recorded history. The energy transition was nowhere to be found.
When the United States and Israel struck Iranian nuclear and military infrastructure on 28 February 2026, the Strait of Hormuz collapsed from 20 million barrels per day (b/d) to 3.8 million within weeks — an 81% reduction in transit. The International Energy Agency (IEA) described it as the worst oil crisis in history, eclipsing the 1970s Arab oil shocks and Russia's 2022 invasion of Ukraine. Brent crude futures peaked at $119 per barrel on 19 March; the physical spot price (North Sea Dated) reached $130, with prompt cargoes trading $20 to $30 above benchmarks. The political reflex was predictable: energy ministers invoked the transition imperative; clean energy indices briefly spiked. The capital moved in the other direction. Since the original shock, two further events have complicated the picture. On 13 April, after US-Iran nuclear talks collapsed, US Central Command activated a blockade on vessels entering or departing Iranian ports, sending Brent 8% higher in a single session. On 16 April, Iran declared Hormuz "completely open" for the ceasefire period, and Brent fell 9.07% the following day. As of 19 April, the ceasefire expires in approximately three days. None of these movements brought the energy transition measurably closer.
Why This Matters?
Historic scale: IEA executive director Fatih Birol called this the worst oil crisis in history. OPEC+ supply fell 9.4 million b/d in March; the April shortfall was modelled to double that of March. Even after a record 412-million-barrel emergency reserve release — the largest in IEA history — ABN AMRO modelled a residual daily deficit of 3.4 to 7 million barrels. Renewables contributed nothing to the emergency response.
Transition mis-pricing: Oil majors are positioned for a $60 billion windfall while clean energy borrowing costs have risen in the same inflationary wave the shock created. Both dynamics run in precisely the wrong direction for the transition timeline.
Structural, not tactical: The ceasefire expires approximately 22 April; US-Iran nuclear talks have collapsed; a US blockade on Iranian ports is now active regardless of whether hostilities resume. The risk premium in oil has a floor that the current relief rally is underestimating.
The Shock in Numbers
The Strait of Hormuz carries approximately 20 million b/d of oil, petroleum products and liquefied natural gas (LNG) — roughly 25% of all global seaborne oil trade. By early April, that flow had collapsed to 3.8 million b/d. OPEC+ supply fell 9.4 million b/d month-on-month in March. Saudi Arabia's output fell from 10.4 million to 7.25 million b/d; Iraq lost nearly two-thirds of its export capacity, dropping from 4.57 million to 1.57 million b/d; Kuwait halved to 1.19 million b/d.
Emergency mitigation was historically large but arithmetically insufficient. Alternative routing — the Saudi west coast pipeline and the ITP pipeline into Turkey — expanded to 7.2 million b/d of capacity. The IEA coordinated a 412-million-barrel emergency strategic reserve release, the largest in its history. ABN AMRO modelled a residual daily deficit of 3.4 to 7 million barrels even after all mitigation, with April's shortfall expected to double March's as in-transit vessels were exhausted. Global oil inventories fell 85 million barrels in March; Singapore middle distillates reached all-time highs above $290 per barrel.
Brent futures peaked at $119 on 19 March. The physical market told a more acute story: North Sea Dated crude reached $130, with prompt cargoes trading $20 to $30 above futures — a dislocation reflecting the near-impossibility of sourcing physical barrels rather than a routine pricing adjustment. On 13 April, after US-Iran nuclear talks collapsed, the US activated its port blockade and Brent surged 8% to $102.39. On 16 April, Iran declared Hormuz "completely open" during the ceasefire; Brent fell 9.07% to $90.38 on 17 April — its first close below $91 since 10 March. As of 19 April, Brent futures trade at approximately $85 per barrel.
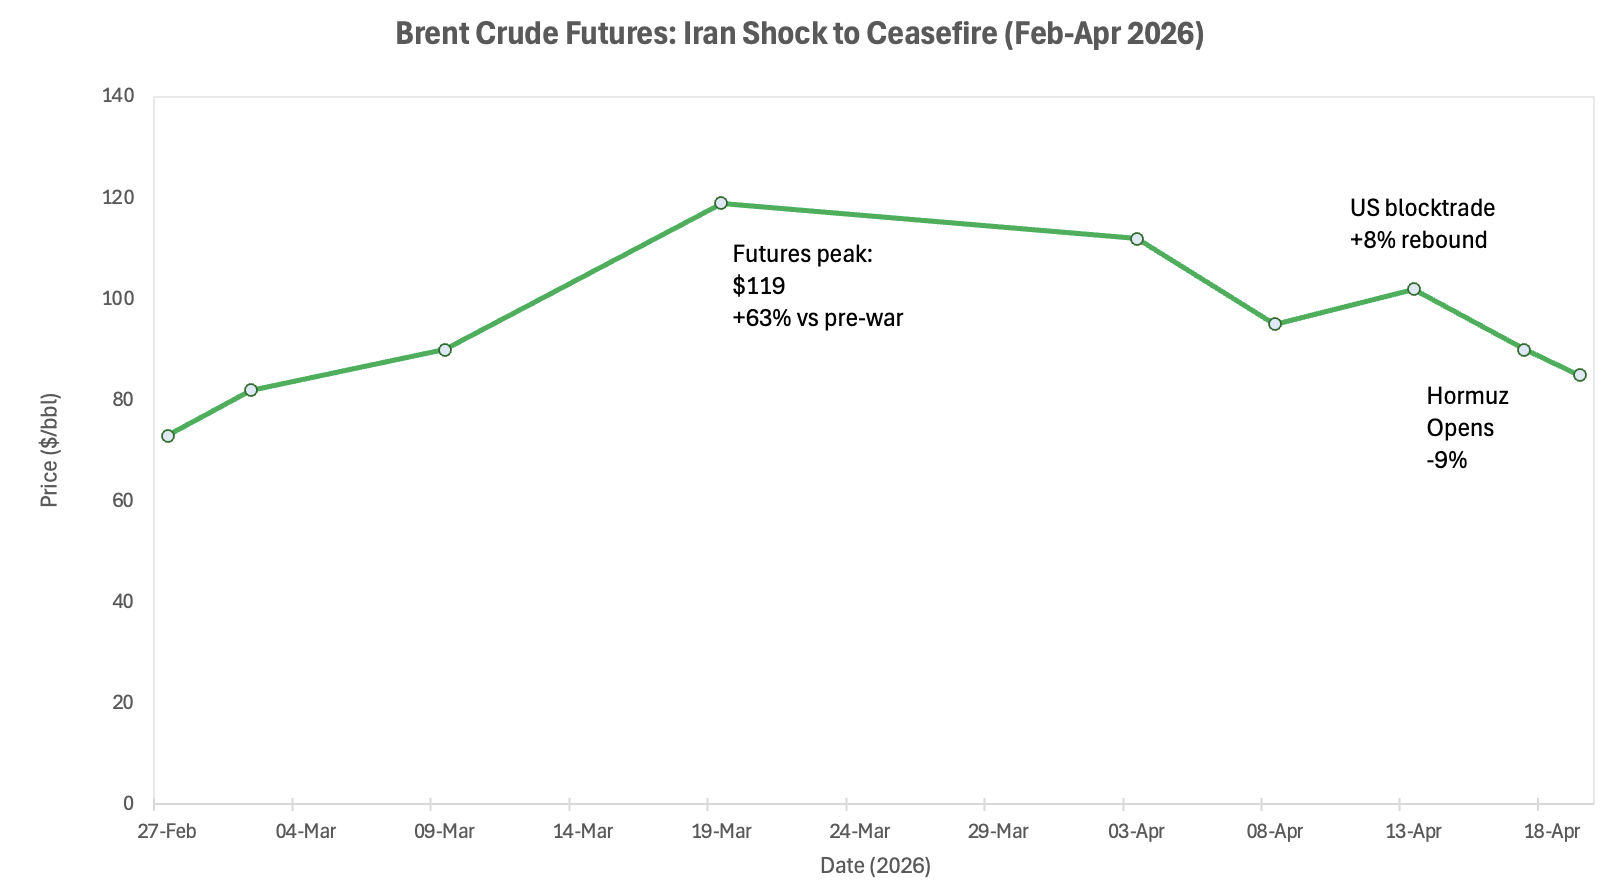
Source: Al Jazeera, Fortune, Bloomberg, Investing.com, TradingEconomics — 2026
The Non-Obvious Mechanism
The consensus argument is that energy shocks reduce oil's relative attractiveness and improve renewable competitiveness by raising fossil fuel costs. This mechanism is real but shallow. What it omits is the asymmetry of response timelines.
A solar or wind project from financing to first generation takes four to seven years in most jurisdictions. An offshore wind permit in France has averaged 11 years; onshore wind approvals in Germany regularly exceed seven. When a shock hits, renewable capacity cannot be deployed fast enough to absorb it. The immediate substitution effect is zero. The cash flow benefit flows exclusively to existing hydrocarbon production.
The transition has its own geopolitical chokepoints that the Iran shock has not resolved. China processes between 50% and over 90% of the world's critical minerals depending on the material. BloombergNEF identifies a structural copper deficit from 2025 onwards, with a potential shortfall of 19 million metric tonnes by 2050. The IEA estimates $800 billion in critical minerals investment is required by 2040 to keep net-zero pathways viable. The Iran shock has not mobilised that capital. It has, however, provided political cover for every new oil exploration programme a board wishes to advance.
The cost-of-capital asymmetry compounds this further. Financing costs account for approximately 50% of the lifetime costs of a renewable energy project at an 8% cost of capital — more than five times the equivalent for fossil-fuelled generation. When rates rise in response to an inflationary oil shock, the relative damage to renewable project economics is disproportionate. Oil majors, flush with windfall cash and investment-grade debt at tightening spreads, face no equivalent constraint. The shock widens the structural gap rather than closing it.
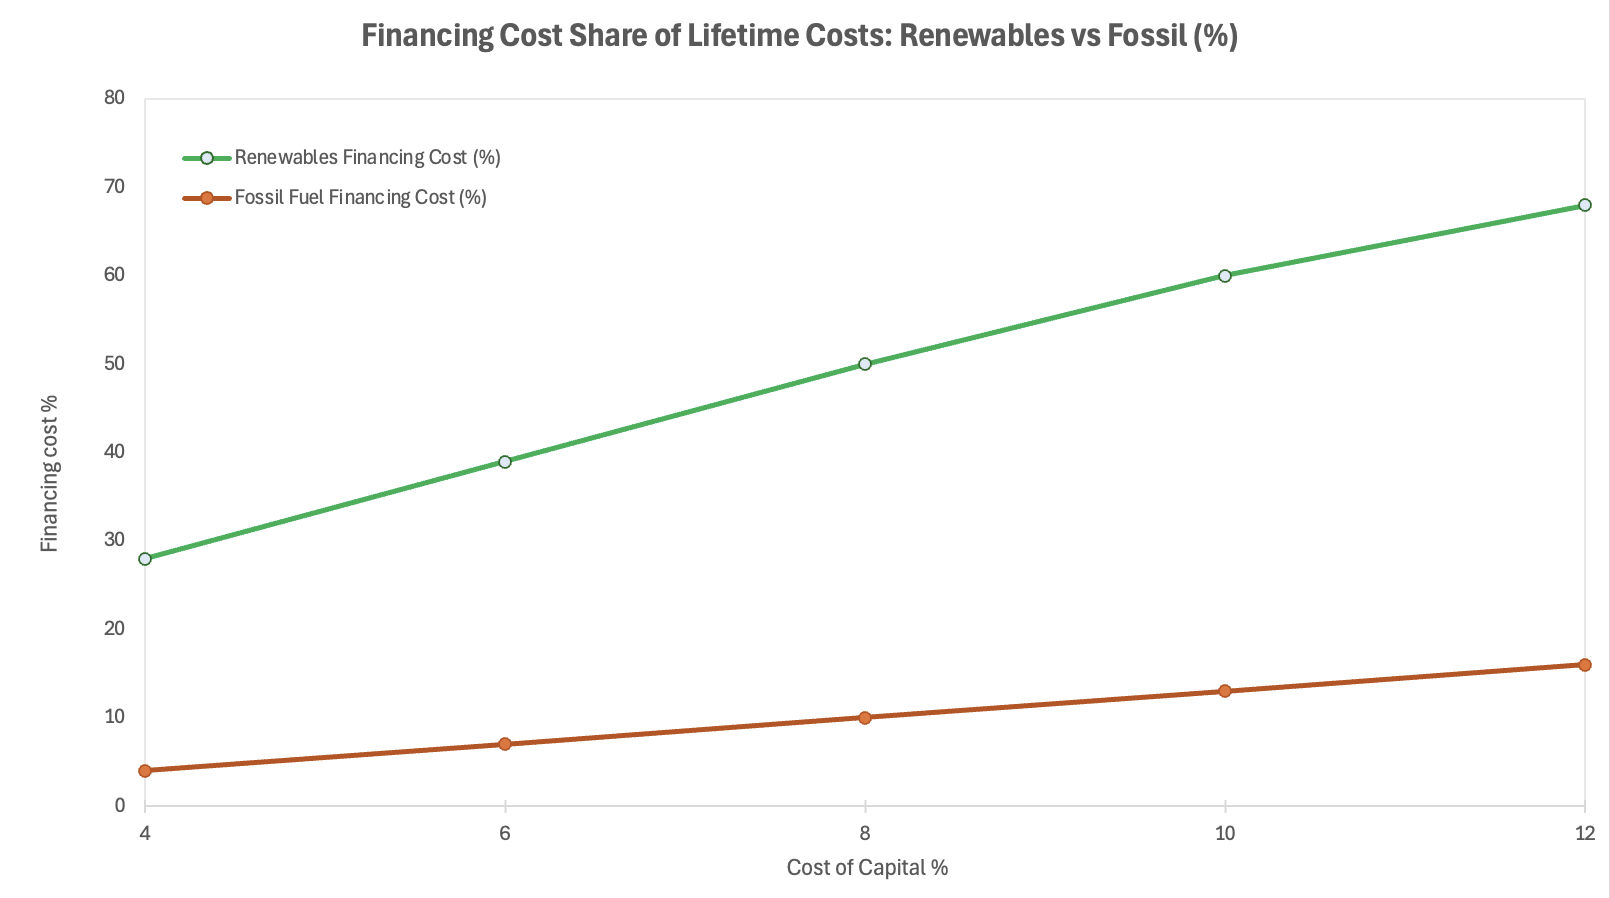
Source: Nature (December 2025) — modelled financing cost share of project lifetime costs
Investor Implications
The mispricing runs in both directions. On the fossil side, the market partially corrected when oil major equities rerated sharply. But it has not fully priced the structural reality: the US blockade on Iranian ports remains active regardless of ceasefire status; Hormuz retains the same structural vulnerability; and no additional bypass capacity has been built. The risk premium has a floor that the current relief rally is underestimating.
On the clean side, the more consequential mispricing is the transition premium still embedded in many long-duration clean energy portfolios and green bond positions. Global clean energy investment reached a record $2.3 trillion in 2025, yet renewable energy funding specifically fell nearly 9.5% year-on-year, driven partly by Chinese regulatory changes. The headline figure flatters the underlying deterioration. The European Central Bank (ECB) noted in February 2026 that 57% of European firms cite access to finance as the primary barrier to green investment — before the shock elevated borrowing costs further.
Sovereign wealth funds and large pension allocators that made net-zero commitments in 2021 and 2022 are now quietly reassessing, using the language of "energy security" to justify adding fossil fuel exposure without formally abandoning green mandates. The political cover the Iran shock provides is not incidental to this shift; it is the mechanism. What was institutionally awkward to justify before February 2026 has become structurally defensible.
Near-Term Catalysts and Policy Outlook
0–3 months: The ceasefire expires approximately 22 April. The US blockade on Iranian ports is now active and, critically, applies regardless of whether direct military hostilities resume. Trump has expressed optimism about concluding the conflict, but US-Iran nuclear talks have collapsed and Iran's nuclear programme remains the central sticking point. Even with Hormuz "open," the physical oil market will take months to normalise: 85 million barrels of inventory depletion cannot be rebuilt in weeks, and the tanker backlog queuing to transit the strait will generate freight rate dislocations through at least May. The IEA flagged jet fuel and diesel shortages spreading from Asian markets to European supply chains by April–May.
3–12 months: If the ceasefire converts to something durable, inventory rebuilding and the unwinding of the physical premium will take three to six months. The IEA retains the option of a second emergency reserve release but a second activation would carry far less market confidence than the first. China's 15th Five-Year Plan (FYP), published March 2026, projects annual clean energy additions to fall by more than half versus the prior plan, with fossil fuel consumption rising 8–10% — removing the demand anchor that justified much of the transition premium in emerging-market clean energy positions. Europe faces the sharpest structural bind: the affordability-versus-transition tension, already politically charged, is now acute across both retail energy prices and sovereign fiscal positions.
Scenarios:
Base: Ceasefire extended but fragile. US blockade maintained, constraining Iranian export capacity without direct re-escalation. Brent stabilises at $85–95 on futures; physical premium persists at $10–15. Oil majors retain elevated cash flows; renewable project financing constrained by elevated rates. Transition capital continues to flow but concentrated in solar and grid infrastructure in markets unaffected by the shock.
Upside: A comprehensive US-Iran diplomatic settlement ends the blockade and the conflict. Hormuz fully normalised. Brent returns toward $70–75. The political cover for fossil fuel expansion weakens, and clean energy capital allocation stabilises. The window for transition re-opens — but structural vulnerabilities in permitting, minerals and cost of capital remain entirely unchanged.
Downside: Ceasefire expires 22 April without extension. Iran activates full asymmetric Hormuz interdiction alongside the existing US blockade. Brent returns toward $110–130 in physical markets. A second IEA reserve release follows, carrying reduced credibility. European energy rationing becomes operationally real. Green mandate credibility among institutional allocators faces its most serious test since the Paris Agreement.
Conclusion
The correct read is structural, not cyclical. The Iran shock did not create the energy transition's vulnerabilities; it revealed them under conditions that capital markets could no longer credibly ignore. The transition was built on an implicit assumption: that policy momentum, falling technology costs and expanding Chinese demand would drive a relatively orderly handover across two to three decades. What that model never adequately priced was the capacity of a single geopolitical event to collapse the timeline asymmetry between existing hydrocarbon production and new clean energy capacity — handing oil incumbents both a cash windfall and a policy reprieve simultaneously.
The ceasefire and the Hormuz reopening change the price, not the problem. The US blockade remains active. Iran's nuclear programme remains a live flashpoint. The physical oil market will take months to normalise. And the structural vulnerabilities of the transition — long permitting timelines, Chinese mineral supply chains, cost-of-capital asymmetry — were not created by this shock and will not be resolved by its ceasing. Portfolios built on the handover narrative face a decade of parallel fossil fuel security spending and clean energy investment running simultaneously: not a clean handover, but a contested, expensive cohabitation that reprices duration risk across both asset classes. The Hormuz crisis may end. The structural argument it has exposed does not.
References
IEA – Oil Market Report, Historic Supply Shock – April 2026
Al Jazeera – Oil Prices Plunge Below $91 as New Hormuz Crisis Emerges – April 2026
Bloomberg – Oil Gains as US Blocks Hormuz, Trump Says Iran Reached Out – April 2026
Reuters – Big Oil to Reap Billions from Iran War Windfall – March 2026
ABN AMRO – Oil Market Monitor: Ripple Effects of Strait of Hormuz Closure – March 2026
Euronews – IEA Warns of Historic Oil Supply Shock – April 2026
Euronews – Oil Prices Drop Over 10% After Iran Declares Hormuz Open – April 2026
CNBC – Oil Supply Crunch Will Worsen in April, IEA Warns – April 2026
Fortune – Current Price of Oil, April 3, 2026 – April 2026
TradingEconomics / Investing.com – Brent Crude Historical Data – 2026
BloombergNEF – Clean Energy Investment Trends; Critical Metals Supply Chains – 2025/2026
Nature – Historical and Future Projected Costs of Capital for Energy Technologies – December 2025
ECB – Overcoming Structural Barriers to the Green Transition – February 2026
UNCTAD – Strait of Hormuz Disruptions: Implications for Global Trade – March 2026
Green Finance Development Council – China's 15th Five-Year Plan Green Transition Analysis – March 2026
US EIA – World Oil Transit Chokepoints – 2025/2026
This article is for information and discussion only and does not constitute investment advice or a recommendation.