When the Strait of Hormuz shut in March 2026, emerging market debt issuance did not slow down but it stopped.
The conflict that began with United States and Israeli strikes on Iranian military facilities in early 2026 has done what most geopolitical crises are said to do but rarely do cleanly: it has repriced sovereign risk on every continent simultaneously. The mechanism is not sentiment. It runs through oil, through the dollar, through inflation expectations, and ultimately through the primary market window that emerging market (EM) governments depend on to roll their debts. Understanding how a waterway in the Gulf became a credit event in Nairobi and Ankara matters more to allocators today than any individual country call.
Why This Matters
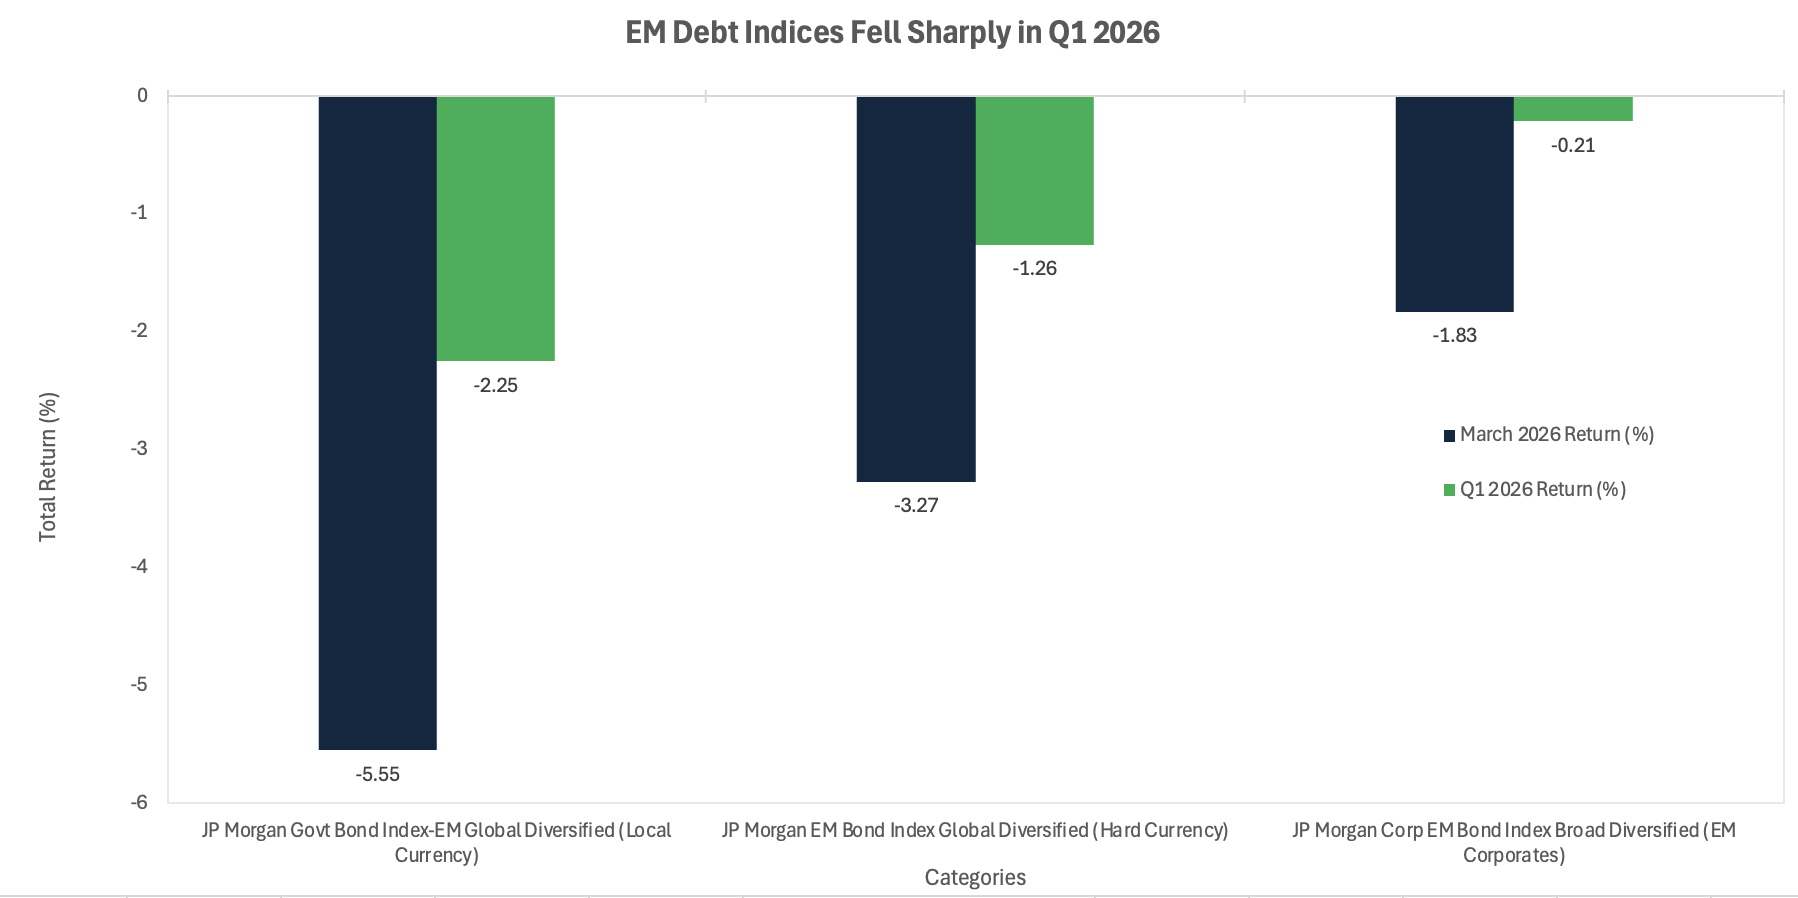
The repricing is real and broad: The JP Morgan Emerging Market Bond Index Global Diversified (EMBI GD) yield rose 51 basis points (bps) to 7.31% in Q1 2026; local currency EM debt fell 5.55% in March alone.
The primary market window closed: A record debt-issuance spree across Central, Eastern European, Middle Eastern and African (CEEMEA) markets in early 2026 froze as the conflict escalated, cutting off refinancing lifelines for the most vulnerable sovereigns at the worst possible moment.
The central bank trap is live: Energy-importing EM policymakers cannot cut rates to support growth without accelerating currency depreciation, which compounds inflation already driven by oil above $100 per barrel.
The Freeze in the Numbers
The quarter began constructively. Broad-based disinflation, a soft dollar, and high real yields had extended the positive tone from late 2025 into early 2026, with EM sovereign spreads tightening to multi-year lows. That reversed sharply from mid-February as US–Iran tensions escalated, and collapsed in March following retaliatory Iranian strikes and the effective closure of the Strait of Hormuz.
Source: JP Morgan, State Street Global Advisors, Q1 2026.
The damage across benchmarks was unambiguous. The EMBI GD spread widened 35 bps to 289 bps over Q1; the index yield rose 51 bps to 7.31%. Local currency debt fared worse: the JP Morgan Government Bond Index-Emerging Markets Global Diversified (GBI-EM GD) returned -2.25% in US dollar (USD) terms in Q1, with a single-month loss of -5.55% in March. EM corporate debt, as measured by the Corporate Emerging Markets Bond Index Broad Diversified (CEMBI BD), held better at -0.21% in Q1, though it fell -1.83% in March as risk appetite collapsed across asset classes.
Thirteen of nineteen GBI-EM GD index currencies depreciated against the US dollar (USD) through Q1. By end-March, EM local currencies were approximately 7% undervalued against the USD on a GBI-EM GD-weighted basis; that undervaluation stood at roughly 4% just one month earlier. Oil, the proximate driver, rose approximately 94% over Q1, with West Texas Intermediate (WTI) closing March at $101.38.
The Transmission Mechanism
The headline story is oil. The structural story is three channels working simultaneously, and it is their interaction that explains why the damage spread so far so fast.
The first channel is the dollar. Safe-haven flows strengthened the USD by 1.67% in Q1, while US Treasury (UST) yields rose approximately 15 bps. That combination tightens the global liquidity backdrop that EM hard-currency issuers depend on and raises the cost of rolling existing dollar-denominated debt.
The second channel is inflation repricing. Brent crude up nearly 100% in a single quarter does not pass through immediately to EM consumer price indices, but it reprices term premia across local rate curves within weeks. Central banks that had been cutting, or were expected to cut, faced an abrupt reversal of the policy easing cycle. Colombia hiked its benchmark rate by 200 bps to 11.25% in Q1; the Central Bank of Turkey held at 37% and signalled further decisions would depend on geopolitical developments; the South African Reserve Bank raised its 2026 inflation forecast to 3.7% and held rates at 6.75%.
The third channel is primary market closure: the one least visible in spread data but most consequential for fiscal sustainability. Investment-grade Middle Eastern and North African (MENA) sovereigns, which had supported non-dedicated credit flows into EM debt for months, became sources of spread widening rather than compression. That shift infected sentiment across non-MENA names, and the issuance window that had been wide open in January and February closed sharply in March.
The non-obvious point, and one that has not been adequately flagged in the mainstream commentary, is that local currency benchmarks are carrying the war's cost twice: once through higher yields as inflation expectations rise, and once through currency depreciation as the dollar strengthens. An allocator long GBI-EM GD was not hedging geopolitical risk; they were compounding it.
Who Bleeds and Who Benefits
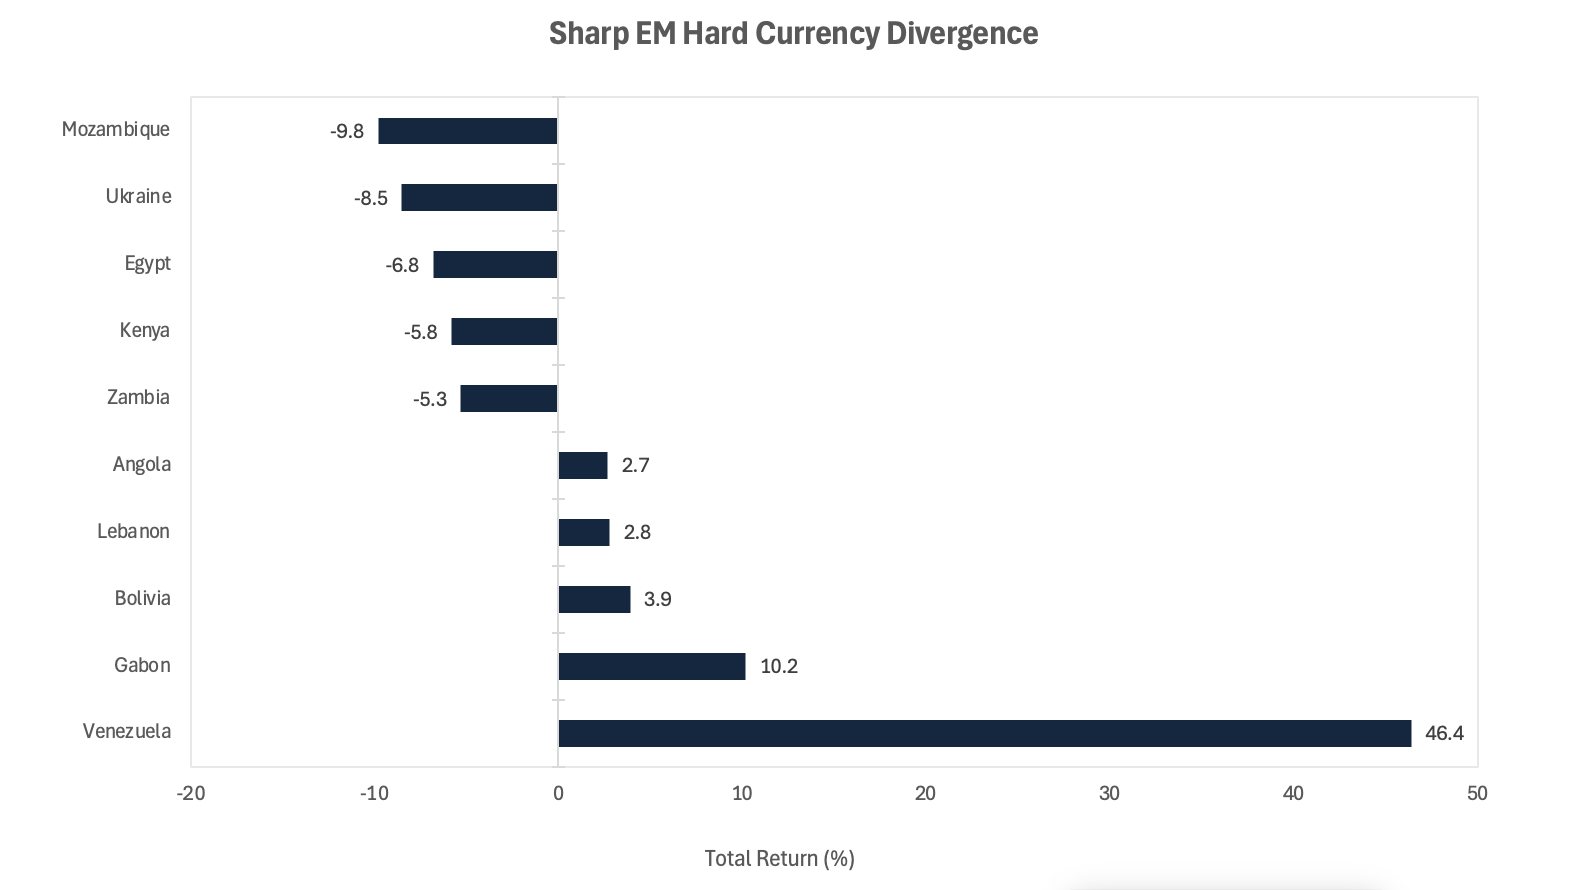
The divergence within the EMBI GD universe in Q1 was stark. Egypt fell 6.8% on a total return basis, detracting 18 bps from index returns: the Suez Canal disruption compounded a structural dependence on portfolio inflows and a worsening current account. Kenya fell 5.8%, hurt by oil import costs and significant Eurobond supply hitting secondary markets simultaneously. Ukraine fell 8.5%; its fiscal deficit and reliance on official external support made it acutely sensitive to any risk-off move, even as the International Monetary Fund (IMF) approved a new $8.1 billion Extended Fund Facility (EFF) in late February. Mozambique was the worst performer in the index, down 9.8%.
On the other side, Venezuela rallied 46.4%, a structural outlier driven by a regime-change trade rather than geopolitics: markets began to price a credible path toward sovereign debt restructuring following the capture of Nicolás Maduro by US forces in January. Angola gained 2.7%, supported by higher oil revenues and proactive liability management.
Source: JP Morgan EMBI Global Diversified Index, State Street Global Advisors, Q1 2026.
The more instructive pattern is in MENA itself. Even oil-exporting sovereigns attracted wider risk premia, because the conflict raises long-term uncertainty about non-oil economic activity and security conditions across the entire region. Qatar halted all liquefied natural gas (LNG) production after Iranian strikes on its Ras Laffan facility; Iranian drone attacks on Saudi Arabia's Red Sea refinery demonstrated that disruption could extend to export routes outside the Strait. The GCC spread premium is not a valuation anomaly; it reflects a permanent widening in the security risk embedded in regional cash flows.
Africa deserves particular attention. The continent entered 2026 having built refinancing buffers during the 2024-2025 issuance window; that buffer is now being consumed faster than anticipated as oil import costs surge and market access narrows. The more likely read is that sub-Saharan frontier names will face acute refinancing stress by Q3 2026 if the primary market remains effectively closed.
Catalysts and Policy Outlook
The next twelve months contain three distinct windows, and the risks in each are not symmetric.
0–3 months: US-Iran ceasefire negotiations are under way, with diplomatic signalling visible as of early April 2026. The Fed held rates at 3.5%–3.75% throughout Q1 and is unlikely to cut while energy-driven inflation expectations remain elevated; that removes a key support for EM carry. The IMF's spring meetings flagged an adverse scenario in which EM sovereign spreads widen a further 100 bps and EM corporate spreads a further 200 bps from current levels. A US Supreme Court ruling invalidating specific tariffs has eased one near-term tail risk for Asian exporters, though broader US trade policy remains uncertain.
3–12 months: A credible and durable Strait reopening would allow oil to retrace toward $75–80 and compress EM spreads by 15–30 bps as the inflation channel unwinds. However, physical damage to Gulf energy infrastructure, including the Ras Laffan facility, suggests the supply disruption premium will remain elevated for at least six months regardless of diplomatic progress. The local currency recovery trade requires both a dollar softening and a credible central bank easing cycle; neither is available at current oil prices.
The range of outcomes beyond mid-year is wide. Three scenarios define the boundaries.
Base case: Ceasefire holds but Strait reopening is partial. Oil retraces to $80–85. EMBI GD spreads compress 15–20 bps. EM local currency recovers 3–4% as dollar softens modestly. Primary market reopens for investment-grade names; frontier access remains constrained.
Upside case: Full Strait reopening, Brent below $70 by Q3. Spread compression 30–40 bps. EM primary markets reopen cleanly. Local currency debt recovers the bulk of Q1 losses.
Downside case: Prolonged disruption, oil sustained above $100, no credible security guarantees for the Gulf. Further IG sovereign downgrades across MENA. Sub-Saharan frontier markets lose primary market access entirely; IMF programme applications rise sharply in H2 2026.
Conclusion
The 2022 Russian invasion of Ukraine taught capital markets that commodity shocks travel through EM debt channels faster than valuations can absorb. The Iran conflict is following the same transmission path. The key structural difference is that EM sovereign balance sheets entered this episode in materially better condition: external buffers are healthier, central banks have more room to absorb first-round energy price shocks, and the 2024–2025 issuance window allowed most investment-grade names to build liquidity cushions.
That resilience is real but bounded. It insulates the core; it does not protect the periphery. The structural read is that proximity to energy choke points is now a permanent component of sovereign credit pricing, not a temporary risk premium that normalises when a ceasefire is signed. No diplomatic resolution can fully close the spread that opened when the Strait shut, because no agreement can credibly guarantee it will not happen again. The allocator question, therefore, is not when EMBI GD mean-reverts. It is whether a spread of 289 bps adequately prices a world in which Middle Eastern supply disruptions are a recurring variable; and whether the local currency carry, currently the most heavily penalised segment, compensates for the dollar risk that now travels with it.
References
State Street Investment Management – Emerging Market Debt Commentary: Q1 2026 – April 2026
Columbia Threadneedle Investments – What Five Weeks of Conflict Mean for Emerging Market Debt – March 2026
Reuters – Emerging Economies' Record Debt Spree Slumps into a Freeze as Iran War Rocks Markets – March 2026
Arab News – GCC Debt Spreads Hit 5-Year High as Iran War Rattles Markets – March 2026
IMF / The Asset – IMF Sets Adverse and Severe Scenarios in Grim War Outlook – April 2026
Lombard Odier – Lessons from Historic Shocks, US-Iran Ceasefire, and Opportunities – April 2026
Tomorrow's Affairs – Iran War Has Increased Africa's Debt Burden – April 2026
AllianceBernstein – What Does the Iran War Mean for Emerging Market Bonds? – April 2026
VanEck – What the Iran War Means for Emerging Markets: EMBX Monthly Commentary – March 2026
This article is for information and discussion only and does not constitute investment advice or a recommendation.