
Priced for Panic, Still Not for Risk: The Ten Geopolitical Threats That Markets Are Reacting To But Cannot Yet Read
Markets are not ignoring geopolitical risk. They are, structurally, choosing not to price it.
Since 2022, the number of active armed conflicts has reached its highest level since the Second World War. The Caldara-Iacoviello Geopolitical Risk (GPR) Index, which tallies newspaper coverage of adverse geopolitical events across ten major publications, has remained persistently elevated, averaging above 180 for three consecutive years. Over the same period, the CBOE Volatility Index (VIX), the market's primary instrument for pricing near-term uncertainty, drifted back towards its long-run average. In April 2026, even as the Strait of Hormuz remained under a dual blockade, the VIX sat at 19. The divergence is not accidental. It is the output of a structural mispricing mechanism embedded in how institutional capital is allocated, measured, and incentivised.
Why This Matters
The measurement gap: The VIX prices a 30-day window of equity volatility, not tail risk across interconnected systems. Geopolitical risk operates on a different time horizon. The instrument is wrong for the problem.
The mandate trap: Most institutional mandates reward relative performance within a cycle, not resilience across one. Pricing geopolitical tail risk means accepting tracking error before the event occurs.
The correlation trap: Ten risks that appear independent are connected through three shared transmission mechanisms. When those mechanisms activate simultaneously, diversification fails exactly when it is needed most.
The Market That Chose Not to Look
The divergence between measured geopolitical stress and implied market volatility has widened sharply since 2023. The GPR Index spent most of 2023 and 2024 above 175, a level historically associated with elevated economic risk and downward pressure on investment. The VIX, meanwhile, averaged 17 in 2023 and fell to 14.8 in 2024, its lowest annual average since before the global financial crisis.
The explanation is structural. The VIX measures 30-day implied volatility in S&P 500 options: it is an effective instrument for pricing short-cycle uncertainty around earnings, central bank decisions, and macro data releases. It is a poor instrument for pricing the probability-weighted cost of a Hormuz closure, a Taiwan semiconductor shock, or a yen carry unwind. These risks do not arrive in the 30-day window the VIX covers. They arrive later, larger, and with less notice than consensus expects. The result is a systematic gap between the geopolitical environment and the price of risk in public markets, a gap that allocators absorb directly on the balance sheet.
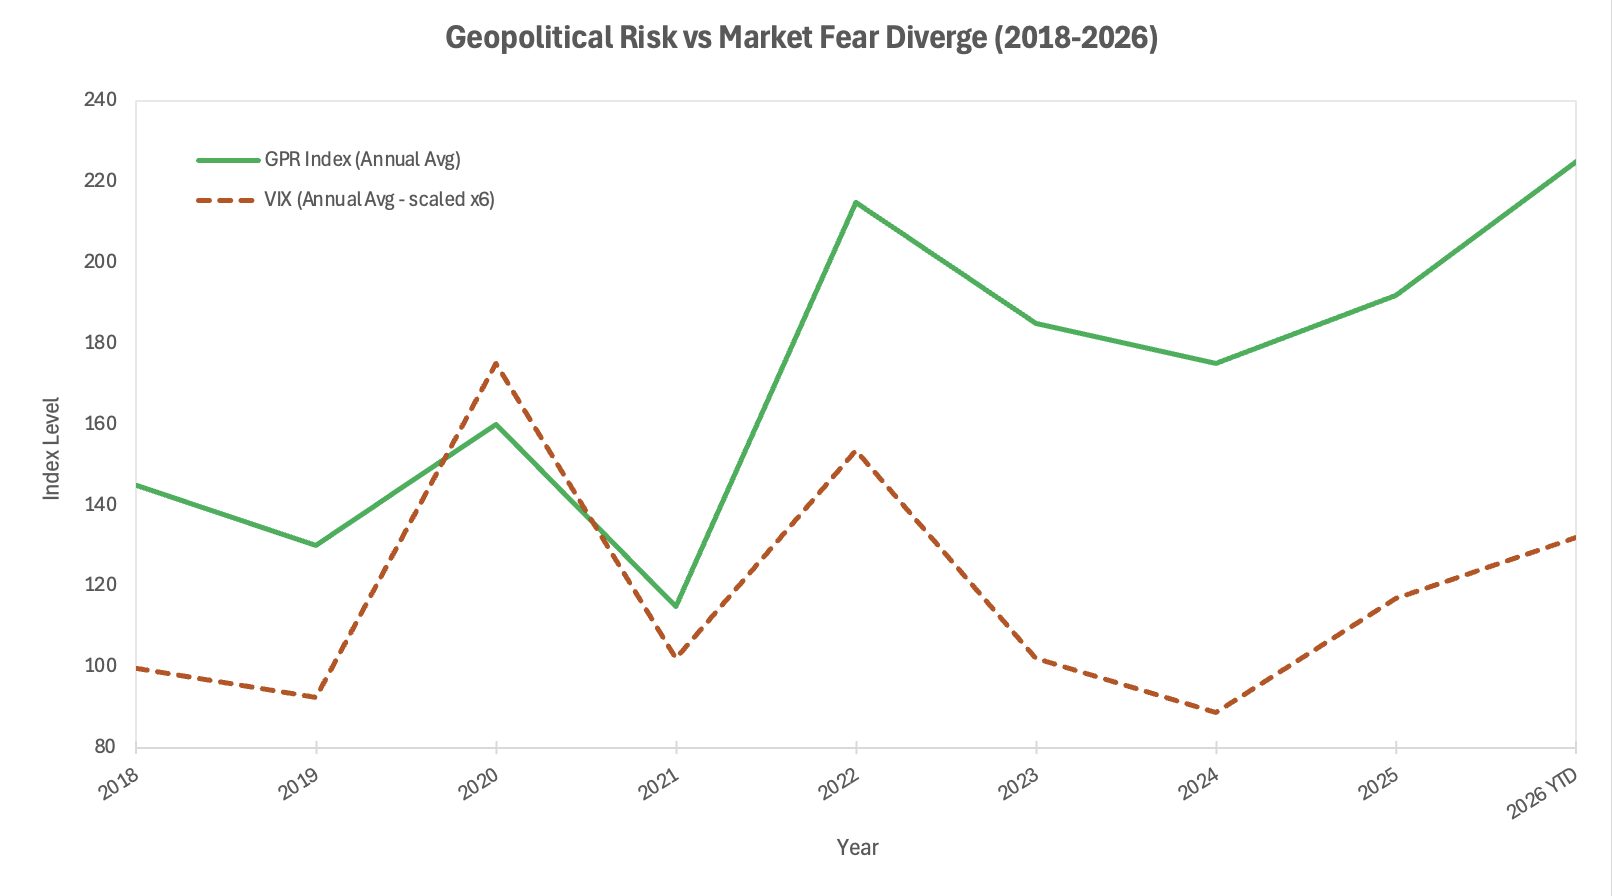
Sources: Caldara & Iacoviello GPR Index; CBOE/St. Louis Fed FRED. GPR indexed to 100 baseline; VIX is annual close average.
Three Mechanisms, Ten Risks
The ten risks explored here do not behave as independent events. They connect through three transmission mechanisms: monetary order stress, supply chain concentration, and fiscal crowding-out. Understanding the mechanism matters more than cataloguing the risks.
The first mechanism is monetary order stress. The US dollar's share of global foreign exchange (FX) reserves has declined from 64.7% in 2017 to 56.3% by mid-2025, according to International Monetary Fund (IMF) COFER data. The shift is gradual, not a collapse, but it is a structural trend: it compresses the demand cushion for US Treasuries at precisely the moment the US fiscal position demands more buyers. Layered on top is the yen carry trade. BCA Research described it in February 2026 as "a ticking time bomb," with total exposure estimated at over one trillion US dollars and Japanese institutions holding substantial US equity and emerging market (EM) bond positions funded at low yen borrowing cost. Each 25 basis point rise by the Bank of Japan (BoJ) tightens the screws on that position. Sovereign debt contagion risk across European periphery and frontier EM closes the loop: a dollar liquidity shock, a yen repatriation wave, and spread widening in European or EM credit could arrive in close sequence.
The second mechanism is supply chain concentration. Taiwan Semiconductor Manufacturing Company (TSMC) produces over 90% of the world's most advanced logic chips. The US-Israeli military operation against Iran, which triggered the current Hormuz crisis from late February 2026, demonstrated how quickly energy supply shocks materialise once the threshold is crossed. The same principle applies to semiconductor concentration with one critical difference: chips cannot be re-routed like oil flows. A Taiwan disruption would have no short-term substitute. The China overcapacity export surge, reshaping EM credit profiles and compressing traded goods margins, adds a third layer to this mechanism.
The third mechanism is fiscal crowding-out. EU defence spending rose from €218 billion in 2021 to €343 billion in 2024 and is forecast to reach €381 billion in 2025, a 75% increase in four years. Germany's constitutional reform exempting defence spending above 1% of GDP from debt limits, combined with a €500 billion special fund, shifts the sovereign credit story materially. The long-term implication for Bund pricing and European Investment Bank (EIB) borrowing costs is not yet reflected in spreads.
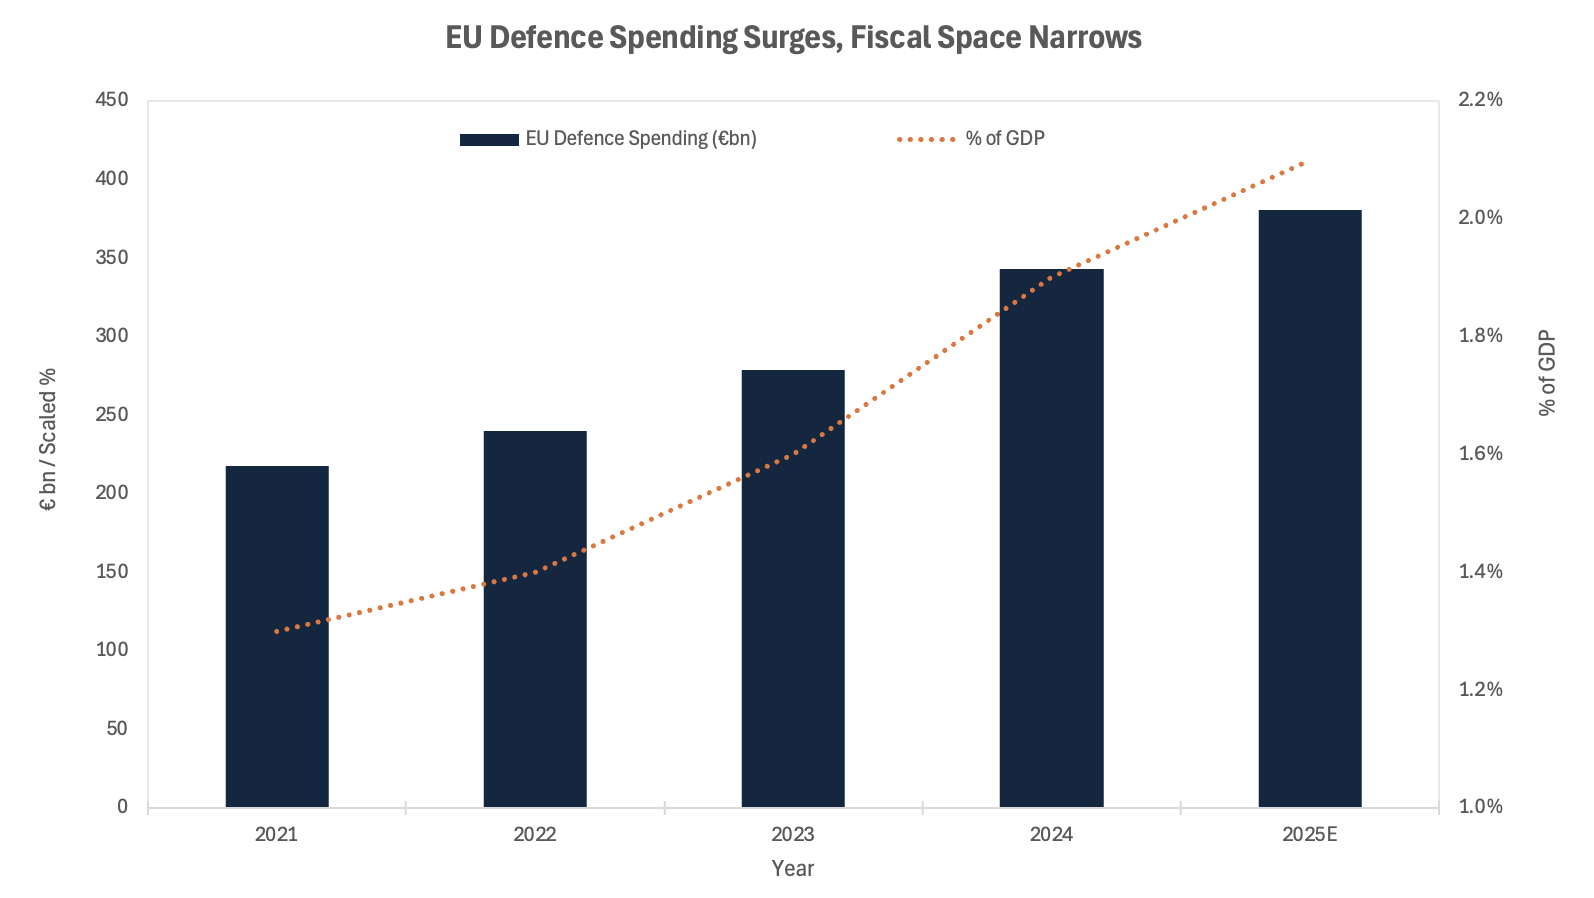
Source: European Defence Agency, Defence Data Report 2024–2025; European Parliament Think Tank.
What This Means for Capital
For institutional allocators, the practical questions are about cash flow timing, cost of capital, and which balance sheets absorb residual risk.
Cash flows in energy-exposed sectors are more volatile than 2024 earnings suggested. Brent crude fluctuated between $94 and $104 in April 2026 alone as the Hormuz situation remained unresolved. Fixed income portfolios with EM duration exposure carry a double risk: a yen repatriation wave and a dollar liquidity tightening would widen EM spreads while underlying currency depreciation erodes returns simultaneously. Both channels are live.
The cost of capital story in Europe is structural, not cyclical. The European Central Bank's (ECB's) path is constrained by the combination of slowing growth and rising sovereign borrowing requirements. For investment-grade European credits with long-duration liabilities, the scenario of spreads remaining contained while underlying rates rise is the optimistic case, not the base case. The more likely read is that fiscal crowding-out begins to register in credit spreads through 2026 and into 2027. The risks not yet reflected in valuations centre on three nodes: TSMC; the dollar's reserve role; and the European sovereign credit adjustment. They are not priced as tail events in current credit default swap (CDS) curves or equity volatility surfaces. They should be.
Catalysts and Scenarios
The next twelve months carry an unusually asymmetric risk distribution: the downside scenarios are structurally larger than the upside ones, and the triggers are already in motion rather than hypothetical. Three of the ten risks discussed above have moved from latent to active since January 2026. The question for allocators is not whether these risks resolve favourably, but whether portfolios are positioned to absorb the path if they do not.
0–3 months: The Hormuz situation remains the live catalyst. A negotiated reopening would compress the oil risk premium quickly, but the structural lesson, that 25% of global seaborne oil trade and 20% of liquefied natural gas (LNG) trade can be interrupted without adequate market preparation, remains unpriced in long-duration energy capital expenditure assumptions. The yen carry position is the secondary watch item: BoJ rate decisions in June 2026 will determine whether the unwind continues in a managed fashion or accelerates.
3–12 months: The EU fiscal story crystallises through autumn bond issuance calendars. German Bund supply will increase materially from the Sondervermögen fund and the €500 billion constitutional programme. The structural case for wider Bund-periphery spreads in a supply-heavy environment is stronger than current pricing implies. The US mid-term cycle compresses fiscal bandwidth: a narrow legislative majority limits the administration's capacity to respond to external shocks with fiscal stimulus.
The three scenarios below are not symmetric in probability or magnitude. The base case assumes partial resolution of live disruptions without a secondary shock; it is the most likely outcome in a narrow sense, but it offers the least information. The more instructive exercise is to map the downside with precision, because the mechanisms that connect these risks, yen repatriation, EM spread widening, European fiscal supply, mean that a downside event would compound quickly across asset classes rather than remaining contained within a single geography or sector.
Base: Hormuz partially resolves; Brent settles between $85 and $95; the BoJ hikes once more in H2 2026; European spreads widen modestly; yen carry unwinds gradually. The VIX drifts to 22–25. Equity valuations compress at the margin.
Upside: Full Hormuz resolution and Iran ceasefire; commodity disinflation; BoJ pauses. Risk assets recover, EM credit tightens, and dollar share stabilises.
Downside: Hormuz closure extends to Q3 2026; TSMC operational disruption from cross-strait military activity; yen repatriation accelerates. Credit spreads gap wider. A disorderly carry-trade unwind triggers a liquidity event comparable in transmission speed to August 2024 but larger in scale.
Conclusion
The Strait of Hormuz blockade, which markets treated as a remote tail risk in January 2026, became an active disruption by late February. That sequence should concentrate the mind. The structural argument here is not that catastrophe is imminent; it is that markets are priced for a mean-reverting world, and the world is not mean-reverting. The ten risks described above are connected, not independent. Their transmission mechanisms are live, not theoretical. The absence of a visible trigger is not the same as the absence of risk. For an allocator with a multi-year horizon, the more defensible position is to treat this as a structurally elevated risk regime, not a series of passing disturbances. Positioning for calm in this environment is not prudent. It is a choice with consequences that are not yet visible in the price.
References
Caldara, Dario and Iacoviello, Matteo — "Measuring Geopolitical Risk," American Economic Review — April 2022
Federal Reserve Bank of San Francisco — "The AI-GPR Index: Measuring Geopolitical Risk using Artificial Intelligence" — March 2026
European Defence Agency — Defence Data Report 2024–2025 — September 2025
European Parliament Think Tank — "EU Member States' Defence Budgets" — March 2026
IMF COFER Database — "Currency Composition of Official Foreign Exchange Reserves" — Q2 2025; Q3 2025
BCA Research via Japan Times — "Yen Carry Trade is a Ticking Time Bomb" — February 2026
Reuters / CNBC — Strait of Hormuz blockade coverage — April 2026
World Economic Forum — Global Risks Report 2026 — January 2026
ESMA — "EU Financial Markets Enter 2026 amid High Risk Environment" — March 2026
St. Louis Fed FRED — CBOE Volatility Index (VIX) historical series — accessed April 2026
This article is for information and discussion only and does not constitute investment advice or a recommendation.