
The Hedger Who Also Captured the Factory
China reduced its energy vulnerability and monopolised the supply chain for everyone else's transition. That is not a trade story. It is a capital allocation story.
The Strait of Hormuz closed in late February 2026. Within weeks, Brent crude exceeded $126 a barrel, LNG spot prices surged above $20 per million British thermal units, and Asian manufacturers from Bangladesh to Bangkok began rationing power. China's factory output index, by contrast, returned to expansion in March. The divergence was not accidental. It was the compound return on two decades of deliberate structural positioning.
Why This Matters
Energy insulation: China's Hormuz exposure covers only 6.6% of total oil use and 0.6% of gas, while competitors face immediate industrial curtailments
Supply chain dominance: China produces the solar panels, wind turbines, and grid components every other Asian economy needs to close the gap — and sets the price
Cost wedge: China's industrial electricity price of roughly $0.088 per kWh, backed by reliable grid infrastructure, undercuts Southeast Asian competitors on a reliability-adjusted basis even where nominal tariffs appear similar
The Core Shift
China's power system has crossed a structural threshold. Renewables accounted for over 60% of total installed electricity capacity by end-2025, and wind and solar alone reached approximately 1.94 terawatts. In January and February 2026 alone, China added a further 45 gigawatts of new renewable capacity, a pace no other economy is approaching. This is no longer a policy aspiration tracked in five-year plan documents. It is a physical reality embedded in the grid.
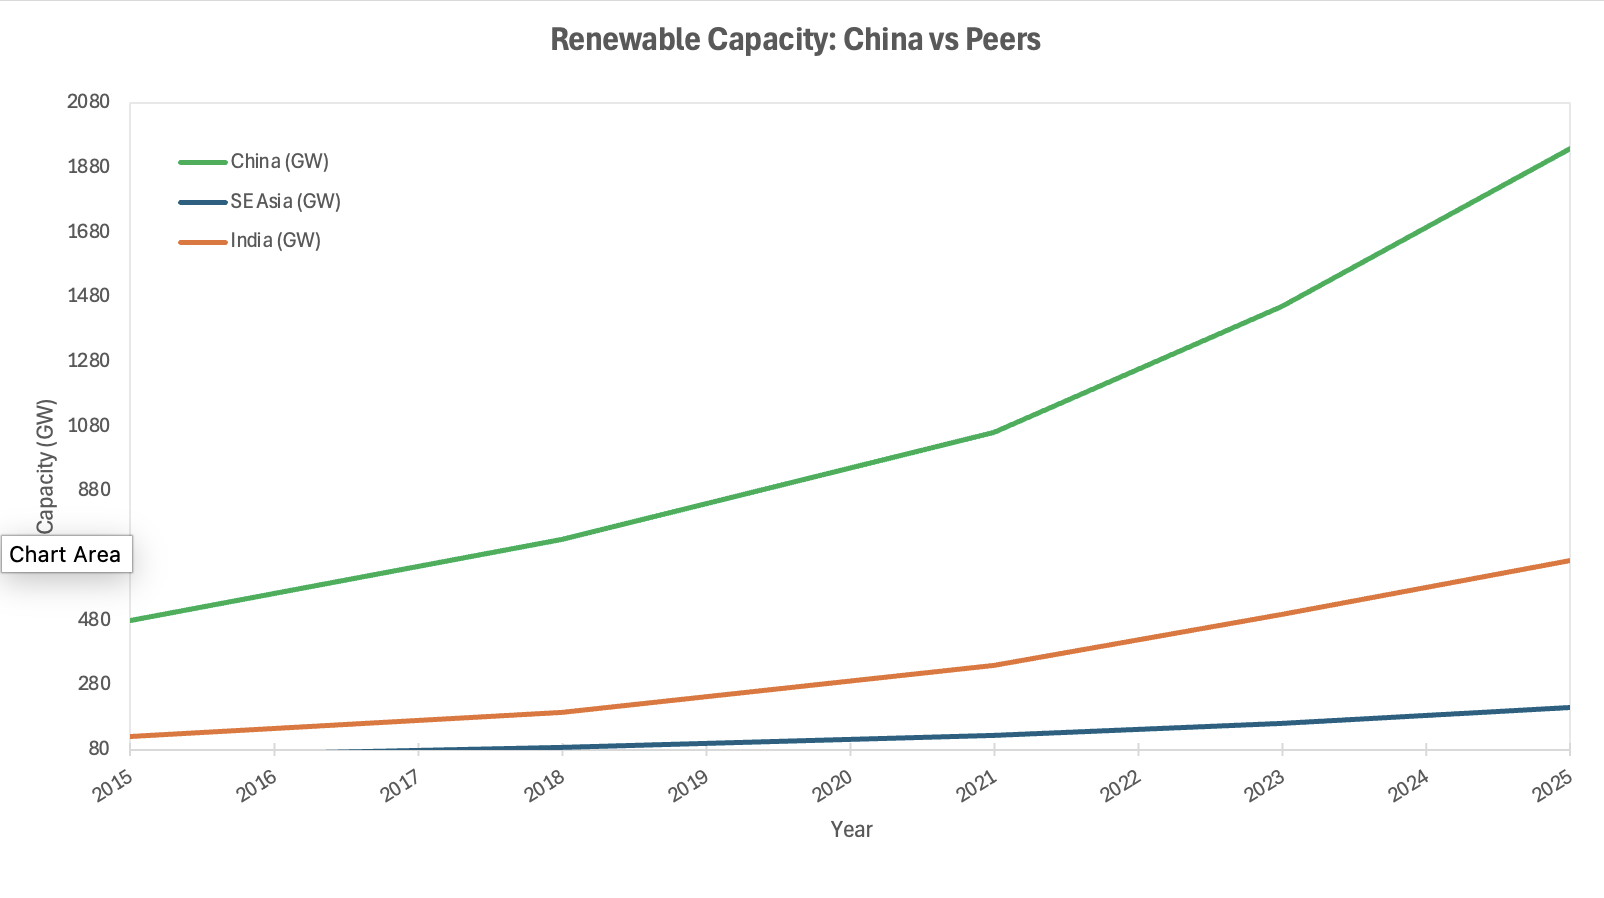
Source: IEA, NEA China, IRENA
The consequence is a structural decoupling from hydrocarbon price cycles. Oil and natural gas represent only 18% and 8% of China's total energy consumption respectively. Electric vehicles displaced over one million barrels per day of implied oil demand in 2024 alone. For the purposes of industrial cost structures, China has effectively pre-hedged a geopolitical risk that is now landing in full on its regional competitors.
The Non-Obvious Mechanism
The consensus read on China's energy transition focuses on import dependency reduction. That is accurate but incomplete. The second-order effect, which most regional analysis has not followed to its conclusion, is that China captured the manufacturing supply chain for every other country's transition at the same time. It holds dominant market share in solar panels, wind turbines, lithium-ion batteries, and grid-scale storage components. Early and large-scale investment in renewables manufacturing secured not just domestic capacity but global standard-setting power.
The structural case is this: every Southeast Asian government that announced an accelerated renewables target after the Hormuz shock must source the hardware primarily from China. That dependency means the transition premium accrues upstream. Vietnam, Indonesia, and Thailand are not closing the energy cost gap; they are paying China to help them try. The more likely read, as capital allocation shifts toward energy security, is that Chinese industrial exporters gain a second-order tailwind: cheaper, more stable electricity at home while competitors absorb both the energy shock and the transition cost simultaneously.
Investor Implications
The immediate implication for cost of capital is asymmetric. Chinese manufacturers operating in power-intensive sectors: chemicals, aluminium, semiconductors, and electric vehicle components, face a structurally lower and more predictable energy cost base than peers in Vietnam or Indonesia, whose industrial tariffs run between $0.098 and $0.120 per kWh, and whose grid reliability imposes additional backup generation costs that do not appear in the headline tariff figure.
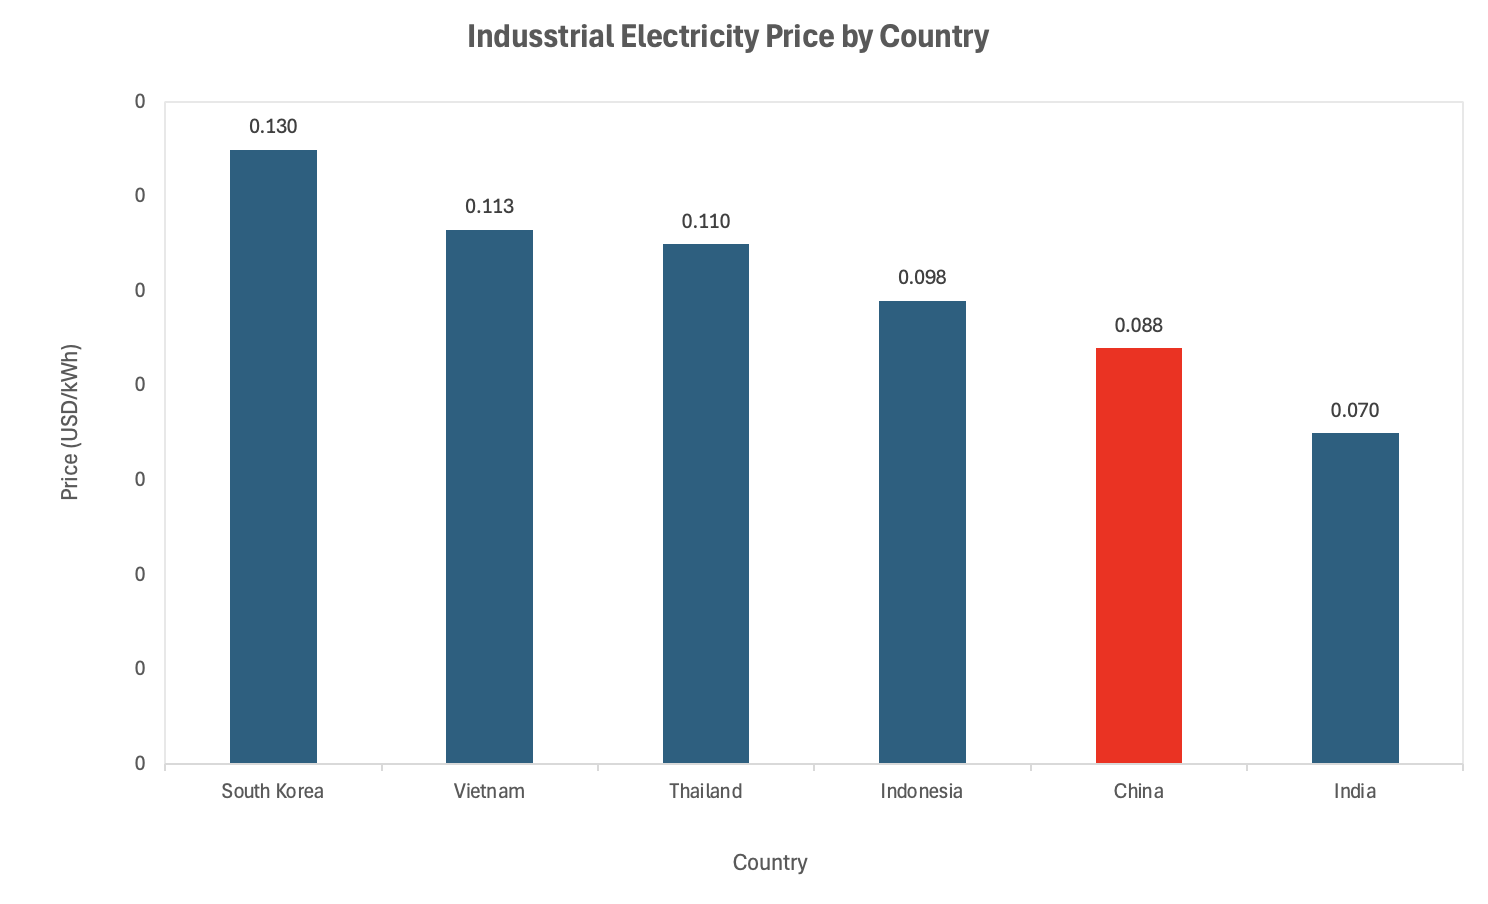
Source: NDRC, IEA, CEIC Data, 2025
Wood Mackenzie estimates that South Asia's LNG demand could be 2–3 million tonnes lower through Q3 2026 due to disrupted Qatari supply, with contract prices set to rise further from June as oil-indexed formulas reset on a three-month lag. That is not a cyclical squeeze. It is a sustained cash flow pressure on balance sheets that were already thin on energy security reserves. Investors with manufacturing exposure in Southeast Asia should be stress-testing their energy cost assumptions against a $20 per million British thermal unit LNG baseline, not the pre-Hormuz forward curve. Portfolios with concentrated exposure to Indonesia's gas-fired industrial base or Vietnam's LNG-dependent power grid carry risks that current valuations have not yet reflected.
The beneficiaries are less obvious than they appear. Domestic Chinese manufacturers with high electricity intensity will see margin expansion relative to regional peers. Chinese solar and battery exporters face accelerating demand from governments suddenly motivated to reduce Hormuz exposure. The less obvious beneficiary is Chinese state-owned grid infrastructure finance, which is now being actively sought by Southeast Asian utilities that cannot build transition capacity fast enough on their own balance sheets.
Catalysts and Outlook
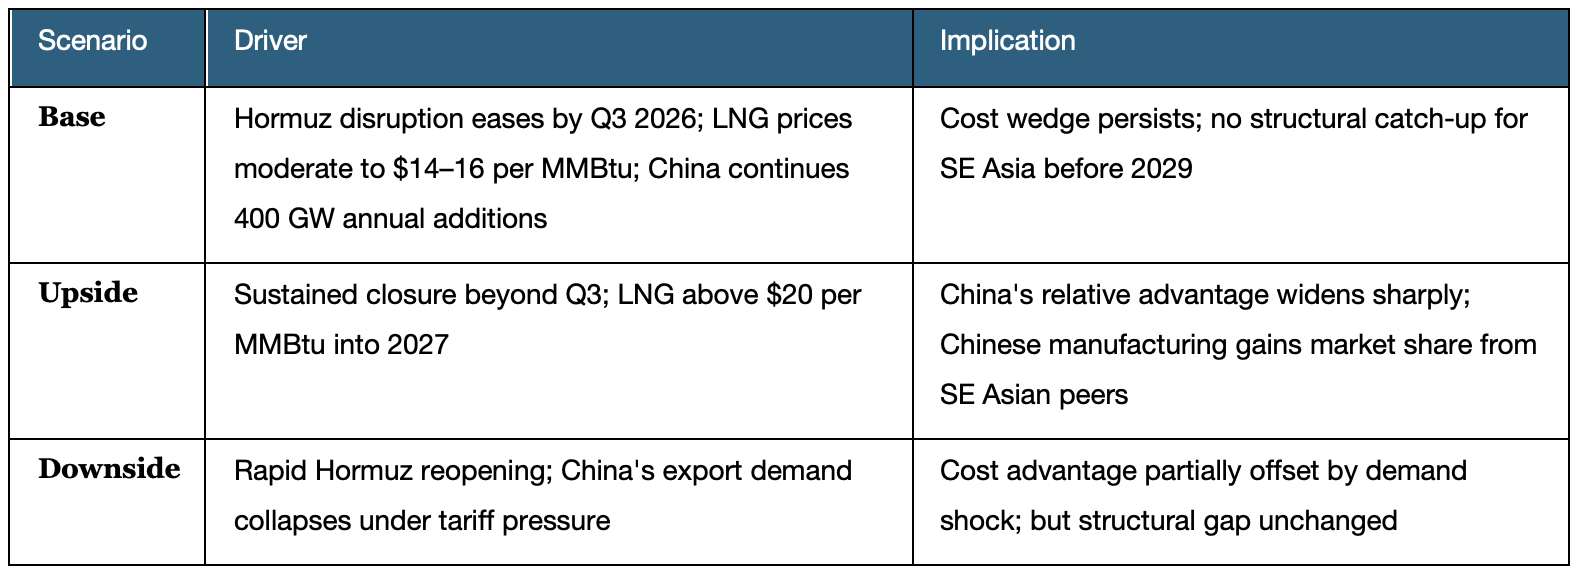
The near-term risk asymmetry is skewed toward sustained divergence, not mean reversion. A rapid Hormuz reopening would provide relief to regional energy prices, but it would not close the structural gap in installed capacity, grid reliability, or supply chain position. That gap compounds quarterly.
0–3 month window: LNG spot markets remain elevated. Oil-indexed contract resets from June 2026 onwards will add a second wave of cost pressure to South and Southeast Asian industrial users, separate from spot price dynamics. China's March PMI expansion will be tested by global demand softness, but its domestic energy cost advantage provides a partial offset to external demand weakness.
3–12 month window: Southeast Asian governments will accelerate renewables procurement commitments, bidding processes, and grid investment announcements. The political pressure to act is high. The execution gap between announcement and physical capacity, however, will take three to five years to close at minimum. In the interim, the competitive cost wedge remains intact and widens with each quarter of continued Chinese capacity addition.
The question is not whether the gap exists but how quickly, if at all, it narrows.
Conclusion
This is not a China bull piece. China's manufacturing sector faces real headwinds from weakening global demand, US tariff escalation, and its own debt-laden property transition. The structural energy argument does not override those pressures. What it does do is sharpen the relative picture.
The structural read-across is this: in a world where energy security has moved from a background macro variable to a front-page capital allocation input, China enters the next phase of regional competition with a hedged cost base, a captive supply chain, and a compounding capacity advantage. Its regional competitors are repricing that exposure in real time, and the adjustment is not yet complete in either equity valuations or sovereign credit spreads.
The geopolitical overlay reinforces rather than complicates this. A prolonged period of Middle East instability, even without formal Hormuz closure, will keep the energy security premium elevated. Every quarter that premium persists is a quarter in which the structural gap widens. Investors who read this as a temporary commodity shock are, the more likely read suggests, misclassifying the nature of what has changed.
References
Nomura Connects – China's Unique Advantage in the Global Energy Crunch – April 2026
Wood Mackenzie – Strait of Hormuz Closure Threatens South Asia LNG Supply – March 2026
China Briefing – China's Industrial Power Rates 2025: A Guide for Investors – May 2025
Enerdata – China Added 45 GW of New Renewable Capacity in January–February 2026 – April 2026
Chinese Government / National Energy Administration – Renewables Account for Over 60% of China's Power Capacity in 2025 – January 2026
Mercom India – China Installed 1.2 TW of Solar, 650 GW of Wind Capacity as of February 2026 – April 2026
ICIS – Strait of Hormuz Closure Starts to Have Major Economic Impact – March 2026
Kiel Institut – The Cost of Closing the Strait of Hormuz: Energy Bottlenecks and Global Food Security – February 2026
Jingsun Power – Summary Analysis of Electricity Prices in Five Emerging Southeast Asian Countries – January 2026
University of Malaya / IJCS – China's Energy Sector and the Search for Structural Power – December 2025
Gulf News – What the Hormuz Shutdown Means for ASEAN's Energy Security – April 2026
TransitionZero – Southeast Asia Energy Trends to Watch in 2025 – February 2025
RH Nuttall – Industrial Electricity Prices in Leading Economies 2025 – July 2025
This article is for information and discussion only and does not constitute investment advice or a recommendation.